There are a number of ways to approach the sinusoidal/periodic function. We were taught to use either GRAPHMATICA or a graphing calculator.
The periodic function equation is y=Asin(Bx+C)+D and that is what you will input into the software of your choice.
A=Amplitude
B=Period (formula for period P=2(pi)/B)
C=Phase shift
D=Verticle shift
Here is a site that demonstrates those values (very usefefull to play around with it)-http://www.ronblond.com/M12/sc.APPLET/index.html
If you are given the sinusoidal function(periodic function) and want to graph it using a calculator
1. press[mode] and make sure that it is on radian NOT degrees
2. press [y=] and input the formula Asin(Bx+C)+D (substitue numbers)
3. press [graph] and behold the squiggly lines
-you may want to adjust the windows setting to get a better picture
If the information is given in tabular data then you will have to use something called SinReg
1. press [stat] and put the data into a list
2. press [stat]-> calc then go down to something called SinReg
3. back at the home screen put in SinReg,L1,L2,Y1
4. turn on the stat plot ([2nd y=]) and press graph
And that my friends is periodic functions in a nut shell.
Tuesday, June 23, 2009

Tuesday, June 2, 2009
Sequences and Series Review
Ok, this is a little late. I would use slideshare for this but, it doesn't want to work nicely. I'll just give you a download link while I fix slideshare.
Sequences and Series PPT
(Sept 10/09)
Update: The PPT link actually works out pretty well and if I were to change the Show to be nice with Slideshare I would have to change quite a bit. I'm just going to leave it the way it is.
Sequences and Series PPT
(Sept 10/09)
Update: The PPT link actually works out pretty well and if I were to change the Show to be nice with Slideshare I would have to change quite a bit. I'm just going to leave it the way it is.
Monday, June 1, 2009


OK guys were going to work with Vectors. Now it's pretty easy... A Vector is anything with a direction and a magnitude. First thing to do is draw a rough looking diagram just to show you more less what is going to look like and to make sure that your on the right track.
Some key words and phrases are:
If you know your directions your going to get this...
These are the few different directions that your going to end up getting....
Always start with the first direction you are given and go clockwise or counter clockwise in the amount of degrease you are given.
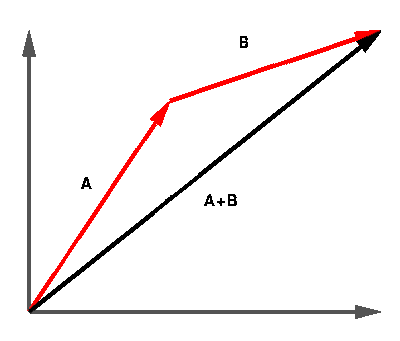
As you see the first direction it is done as i said but the second direction is a bit more tricky. When you draw you first line just draw it till the distance you need to go. For example it may say 5km when of coarse you couldn't draw it. Make a scale that makes since to the amount of space you have to draw it. 1km may be one centimeter. When you draw your second line you must imagine or draw a norther grid as the end of line and draw the second line just like the first.
If the question asks you what is the distance, "the way the crow flys" it's as simple as measuring the distance back to the staring point. If you have drawn it to scale and wrote down the right distances just use a ruler for the distance.
Some key words and phrases are:
One of the things you going to run into is a ''Bearing" a bearing will be given to you in a number, that number is the amount of degrees it is clockwise from north. For example a bearing of 90 would mean that it would straight east.
If you know your directions your going to get this...
These are the few different directions that your going to end up getting....
North of East
East of North
East of South
South of East
South of West
West of South
West of North
North of West
East of North
East of South
South of East
South of West
West of South
West of North
North of West
For example if you have "North of East" you would look at the north spot and travel East. Now to throw something else in there is going to be a number like "North 45 East"
Always start with the first direction you are given and go clockwise or counter clockwise in the amount of degrease you are given.
When your writing your question down you have to be as accurate as possible because you will be given two or more directions and have to measure the distance back...
This is Vector addition
As you see the first direction it is done as i said but the second direction is a bit more tricky. When you draw you first line just draw it till the distance you need to go. For example it may say 5km when of coarse you couldn't draw it. Make a scale that makes since to the amount of space you have to draw it. 1km may be one centimeter. When you draw your second line you must imagine or draw a norther grid as the end of line and draw the second line just like the first.
If the question asks you what is the distance, "the way the crow flys" it's as simple as measuring the distance back to the staring point. If you have drawn it to scale and wrote down the right distances just use a ruler for the distance.
Good luck...
Stats unit review, (confidence intervals)
This is a piece of the STATS unit review.
Confidence intervals.
A confidence interval is… “Predicting the likelihood that the mean of a sample occurs within a certain interval, a certain percent of the time”.
90%...95%...99%... sizes of confidence intervals considered “worthwhile” for statistical prediction purpose.
Here is an example question:
A research study on fruit flies found that an average of 50% of them stay alive after 32 hours.
a) Determine the 95% confidence interval for the percentage of a sample of 1000 fruit flies still alive after 32 hours. Show your work.
Here is what you do.
In your calculator, press the buttons… STAT then TESTS. Go to Prop z-int and it brings up this screen.
X:
N:
C-Level:
Calculate
X is your mean, N is your total number, so in this example your X would be 500, and your N would be 1000. Your C-level is 95. Press calculate and you should get this screen.
1-PropZInt
(.046901,.053099)
P=.5
N=1000
Your percentage interval is (.046901,.053099)
After every question you need to explain the meaning of the confidence interval. So in this example you would write….
If a similar experience/survey/poll were conducted this interval (46.9, 53.1) means that we are 95% confident that 32 hours later out of the 1000 fruit flies between 46,9 and 53.1 percent of them will remain alive.
I hope you are confident with this part of the unit, and if you have any questions please place them in the comments section and I will do my best to answer them.
Confidence intervals.
A confidence interval is… “Predicting the likelihood that the mean of a sample occurs within a certain interval, a certain percent of the time”.
90%...95%...99%... sizes of confidence intervals considered “worthwhile” for statistical prediction purpose.
Here is an example question:
A research study on fruit flies found that an average of 50% of them stay alive after 32 hours.
a) Determine the 95% confidence interval for the percentage of a sample of 1000 fruit flies still alive after 32 hours. Show your work.
Here is what you do.
In your calculator, press the buttons… STAT then TESTS. Go to Prop z-int and it brings up this screen.
X:
N:
C-Level:
Calculate
X is your mean, N is your total number, so in this example your X would be 500, and your N would be 1000. Your C-level is 95. Press calculate and you should get this screen.
1-PropZInt
(.046901,.053099)
P=.5
N=1000
Your percentage interval is (.046901,.053099)
After every question you need to explain the meaning of the confidence interval. So in this example you would write….
If a similar experience/survey/poll were conducted this interval (46.9, 53.1) means that we are 95% confident that 32 hours later out of the 1000 fruit flies between 46,9 and 53.1 percent of them will remain alive.
I hope you are confident with this part of the unit, and if you have any questions please place them in the comments section and I will do my best to answer them.
Friday, May 29, 2009
Grouped Data
We learnt about grouping data, and ways to use use it.Grouped Data is data put into a chart or organized as a group.
As a class we did an example: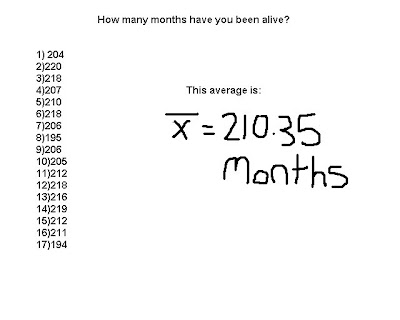 You find the average by adding up all your results from the data and divide by how many sets there are. In our example we took the sum of everything and divided by 17 to get 210.35 as an average.
There are many ways of organising data (T-chart, Venn Diagram, Etc)
Here is another way of showing our results:
You find the average by adding up all your results from the data and divide by how many sets there are. In our example we took the sum of everything and divided by 17 to get 210.35 as an average.There are many ways of organising data (T-chart, Venn Diagram, Etc)
Here is another way of showing our results:

Here we took the averages, and used tally marks to show how many of the numbers from our data fall into place of the averages. Your tally marks must add up to how many sets of numbers you have. In our Example our tally marks add up to 17.
Wednesday, May 20, 2009
Probability
Sample Space -can be defined as any complete and total representation of the outcomes in a probabaility situation.
Ex. Roll a regular 6 sided die; spin a spinner (numbered 1-4).

A'=(1-A)
A+A'=1
The definition of A is one thing or one sample. The definition of A' is everything else involved except A.

 Starting at the house CO-OP you head home but have to stop at Bob’s house to pick up your homework. You can only head South and East. How many ways can you get home from the CO-OP while stopping at Bob’s house?
Imagine encountering a problem like this…DON’T RUN AWAY IT’S EASY!!
You use Pascal’s Triangle. You first figure out the larger rectangle then the square.
You start off by adding the two ones to get 2. You then add the next one on the side and the two you just got to get three, you continue by adding the two numbers beside each other and putting their sum in the box below UNTIL you reach the red square, this is the stop point. You then start again in the new square and stop at the stop point.
You then add the two numbers that are in the red boxes, which are 126 and 6.
126+6=132
So therefore there are 132 ways to get from CO-OP to Home.

Ex. Roll a regular 6 sided die; spin a spinner (numbered 1-4).
Represent/show/display/sketch…. “The sample space”
6x4=24 possible out comes in the sample space.
6x4=24 possible out comes in the sample space.
The sample space is:
(1, Green) (1, Red) (1, Orange) (1, Blue)
(2, Green) (2, Red) (2, Orange) (2, Blue)
(3, Green) (3, Red) (3, Orange) (3, Blue)
(4, Green) (4, Red) (4, Orange) (4, Blue)
(5, Green) (5, Red) (5, Orange) (5, Blue)
(6, Green) (6, Red) (6, Orange) (6, Blue)
(1, Green) (1, Red) (1, Orange) (1, Blue)
(2, Green) (2, Red) (2, Orange) (2, Blue)
(3, Green) (3, Red) (3, Orange) (3, Blue)
(4, Green) (4, Red) (4, Orange) (4, Blue)
(5, Green) (5, Red) (5, Orange) (5, Blue)
(6, Green) (6, Red) (6, Orange) (6, Blue)
Everything and al possibilities are displayed
Mutually Exclusive and Mutually Inclusive Events
mutually exclusive events CANNOT occur together
ex:

Events A and B are mututally exclusive, they are disjoint sets. ( they have no common members)
The following formula is the only formula to be used with mutually exclusive events ONLY!
P(A or B)= P(A) + P(B)
ex: What is the probability in a regular deck, on a single card flip, of drawing a face card or a 5?
A: face card
B: 5
P(A or B)= P(A)+P(B)
P(f or 5)=P(f)+P(5)
P(f or 5)=P(f)+P(5)
=12/52+4/52
=16/52
=4/13 or 31%
=16/52
=4/13 or 31%
Mutually inclusive events DO happen together
ex:
A:face card- 12/52
B: red cards-26/52
B: red cards-26/52
38/52 is WRONG
because you cannot count them twice!!
the correct way to do this is:
P(AorB)=P(a)+P(B)-P(A and B)
=12/52+26/52-6/5
=32/52 or 8/13 or 61.5%'
*use venn diagrams* put examples of mutually inclusive and exclusive events venn diagrams

the above are venn diagrams of the two examples given earlier.
-------------------------------------------------------------------------------------------------------------------------------------------------------------------------------------------------
INDEPENDENT/DEPENDENT EVENTS
*involves chronology of events(order in time)
Independent events do NOT have an effect on each other (ie. successive coin flips)these events are random.
Dependent events do have an impact on some subsequent probability event (ie. newest thing Depends on an older thing) these are not random.
example of dependent events
ex: "with or without replacement"
socks from a drawer
balls from an urn
Take for example the famous game off of "The Price Is Right" 3-Strikes game.
Fundamental Counting Principle:
When order doesn’t matter you use nCr. You enter the first number (number of letters in the alphabet, number of 5 cards poker hands, etc…), press math, PBR, nCr, the second number (the number of letter code words/the number of diamonds and hearts, etc…).
When order does matter you use nPr. You enter the first number (number of letters in the alphabet, number of 5 cards poker hands, etc…), press math, PBR, nPr, the second number (the number of letter code words/the number of diamonds and hearts, etc…).
A'=(1-A)
A+A'=1
The definition of A is one thing or one sample. The definition of A' is everything else involved except A.
Pascal's Triangle:

 Starting at the house CO-OP you head home but have to stop at Bob’s house to pick up your homework. You can only head South and East. How many ways can you get home from the CO-OP while stopping at Bob’s house?
Imagine encountering a problem like this…DON’T RUN AWAY IT’S EASY!!
You use Pascal’s Triangle. You first figure out the larger rectangle then the square.
You start off by adding the two ones to get 2. You then add the next one on the side and the two you just got to get three, you continue by adding the two numbers beside each other and putting their sum in the box below UNTIL you reach the red square, this is the stop point. You then start again in the new square and stop at the stop point.
You then add the two numbers that are in the red boxes, which are 126 and 6.
126+6=132
So therefore there are 132 ways to get from CO-OP to Home.

Monday, May 4, 2009
Design and Measurement
For our class assignment my group is in charge of Design and Measurement so hear it is.
In the Design and Measurement unit every thing was pretty straight forward. Basically all that you had to do was multiply the amount of material that you were using and multiply it by the price of the material, or if your looking for how much material there is left over you subtract how much you use by the total material used. Vice versa if your looking for how much material you used.
Here is an example.
A ballpark is to be built according to the following diagram.
A fence is to be put up around the entire park.
Fencing costs $1.35 per running foot.
The infield area that is to have shale on it needs to be dug down 18"(inches) so that one foot of gravel can be put down as a base and the 6"(inches) of shale put on top.
The cost of excavation is $9.00 per cubic yard.
Gravel costs $7.00 per cubic yard and shale costs $9.50 per cubic yard.
The remaining area of the park needs to have 4"(inches) of topsoil on it and sod put on top of the soil.
Topsoil costs $20 per cubic yard and sod costs $1.25 per square foot.
The grass needs to have fertilizer as soon as it is laid.
The fertilizer costs $15.60 per bag and a bag will cover 75 square yards.
Find the total cost of this project.
P.S.T. at 7% and G.S.T. at 5% apply to all materials used. Only G.S.T. applies to the excavation cost.

Start off by finding the area of the entire park, the infield and outfield, this will save you some time later on.
Area of entire ballpark is Area=Pi r^2 (Pi radius squared)
=Pi 240^2
=180955.7 /4 = 45238.9 feet square
Area or infield is Area=Pi r^2 (Pi radius squared)
=Pi 125^2
=49238.4 /4 = 12271.85 feet square
You have to divide these two answers by 4 because you are finding the area of an entire circle and you only want the area of a quarter the entire circle.
To find the outfield area subtract the infield are from the entire ballpark area.
45238.9 - 12271.85 = 32967.05 feet square
Now we can start figuring out the cost of the park.
Cost of Fence- Perimeter = 2Pi r
= 2Pi 240
= 1508 /4 = 377 + 2(240) = 857 * $1.35 = $1156.95
Cost of infield
Excavation- Cost = 1.5 * 12271.85 /27 = 681.8 * $9.00 = $6136
When finding the cost of something that is in yards we need to divide by 27 because the area we found is in feet.
Cost of Shale- Cost = 1/2 foot or .5 * 12271.85 = 227.3 * $9.50 = $2159.35
Cost of Gravel- Cost = (1 foot or 1 * 12271.85) /27 = 454.51 * $7 = $3181.57
Cost of Topsoil- Cost = (4 inches/12 inches * 32967.10) /27 = 407 * $20 = $8140
Cost of Sod- Cost = 32967.10 * $1.25 = $41208.88
Cost of Fertilizer- Cost = 32967.10 /27 /75 = 16.3 * $15.60 = $254.30
Now add up all of the purple prices to get a total of $56101.05
Now find the total excavation cost tax included. $6136 * 1.05 = $6442.8
Then find the total material cost plus tax. $56101.05 * 1.12 = $62833.18
Finally add the two totals in red to get your final total of $69275.98
Thursday, April 30, 2009
today we did some math stuff. we learned about half-life and maintenance level. half-life is half the time for half the substance to be gone. maintenance level is when a person ingests a substance at regular time intervals, the amount of the substance in the blood eventually levels off, of stabilizes.
Tuesday, April 28, 2009
using microsoft excel for sequences
today in class we used a program called microsoft Excel. it was an easier way to find out the answer for sequences in a faster manner. you type in the first couple formulas and titles and from your specific question. ex. =b2*2 or =C2+.5. then scroll to the bottom to find the answer for the specific number your looking for.
Monday, April 27, 2009
today we learned about sequences
sequences are very exciting and fun to do
there are 2 different kinds of sequences
arithmatic sequences are found by adding or subtracting a common number ex: 2,4,6,8
geometric sequences are found by multiplying a common ratio
ex: 2,4,8,16
a recursive formula is based on the preceding term
the formula is tn=tn-1x2
nMin=1st term
u(n)=formula
u(mim)=value of first term
on the calculator
sequences are very exciting and fun to do
there are 2 different kinds of sequences
arithmatic sequences are found by adding or subtracting a common number ex: 2,4,6,8
geometric sequences are found by multiplying a common ratio
ex: 2,4,8,16
a recursive formula is based on the preceding term
the formula is tn=tn-1x2
nMin=1st term
u(n)=formula
u(mim)=value of first term
on the calculator
Friday, April 24, 2009
Tuesday, April 21, 2009
Monday, April 20, 2009
Hello Everyone,
I would like to start off by stating that we have a test on Personal Finance on, Thursday April 23rd, 2009. So Study Study Study!!
~***Personal Finance Review***~
4.1 Investing Money
Use compound interest formula
Use two spreadsheets
Use TVM Solver
Rule of 72
4.2 Investing for the Future
What is an RRSP – how does it work?
Use spreadsheets created
4.3 Investment Portfolios
Types of investments
Strategies based on age – not complex
4.4 Leasing
Residual values
Use LEASEBUY spreadsheets
4.5 Mortgages
Basic terminology- amortization period, term, rate, semi-annual(2)
Use TVM solver to calculate payments
4.6 Renting vs. Buying
Use RENTBUY spreadsheet – corrections
Advantages & Disadvantages of Renting & Buying a House.
*** Using TVM Solver***
N: Total Number of payments
I%: annual interest rate as a percent
PV: present value
PMT: payment each period
FV: future value, or accumulated amount
P/Y: number of payments per year
C/Y: number of compounding per year.
TVM Question [Example]
1. Solve for FV (future value)
You decide to invest $6500. The bank offers an interest rate of 8.25% compounded annually. What will your money be worth in 7 years if the interest rate remains unchanged?
N=7 N=7
I%=8.25 I%= 8.25
PV= -6500 PV= -6500
PMT=0 PMT= 0
FV=0 FV= 11321.62307
P/Y=1 P/Y= 1
C/Y=1 C/Y= 1
**It shows that in 7 years your money will be worth $11321.62.**
{*For More Review You Can Go To Page 201 In Your Text**}
Today in class we learned about tutorial 4.6 Renting vs. Buying. We learned about Advantages and Disadvantages of Renting and Buying.
Here are some Advantages and Disadvantages of Renting or Buying a house.
Advantage Disadvantage
Renting : Not locked In Not Your Own
Cheaper Can Not Renovate
Short- Term Money Down the DrainI would like to start off by stating that we have a test on Personal Finance on, Thursday April 23rd, 2009. So Study Study Study!!
~***Personal Finance Review***~
4.1 Investing Money
Use compound interest formula
Use two spreadsheets
Use TVM Solver
Rule of 72
4.2 Investing for the Future
What is an RRSP – how does it work?
Use spreadsheets created
4.3 Investment Portfolios
Types of investments
Strategies based on age – not complex
4.4 Leasing
Residual values
Use LEASEBUY spreadsheets
4.5 Mortgages
Basic terminology- amortization period, term, rate, semi-annual(2)
Use TVM solver to calculate payments
4.6 Renting vs. Buying
Use RENTBUY spreadsheet – corrections
Advantages & Disadvantages of Renting & Buying a House.
*** Using TVM Solver***
N: Total Number of payments
I%: annual interest rate as a percent
PV: present value
PMT: payment each period
FV: future value, or accumulated amount
P/Y: number of payments per year
C/Y: number of compounding per year.
TVM Question [Example]
1. Solve for FV (future value)
You decide to invest $6500. The bank offers an interest rate of 8.25% compounded annually. What will your money be worth in 7 years if the interest rate remains unchanged?
N=7 N=7
I%=8.25 I%= 8.25
PV= -6500 PV= -6500
PMT=0 PMT= 0
FV=0 FV= 11321.62307
P/Y=1 P/Y= 1
C/Y=1 C/Y= 1
**It shows that in 7 years your money will be worth $11321.62.**
{*For More Review You Can Go To Page 201 In Your Text**}
Today in class we learned about tutorial 4.6 Renting vs. Buying. We learned about Advantages and Disadvantages of Renting and Buying.
Here are some Advantages and Disadvantages of Renting or Buying a house.
Advantage Disadvantage
Renting : Not locked In Not Your Own
Cheaper Can Not Renovate
No Pets/ No Parties:(
Buying: Your Own Locked In
You Can Do Whaterver You Want Monthly Mortgage and Other Bills
Long-Term
Expensevi
This may come in handy to those graduating and moving next year. This may also help you when it comes to renting a house.
**For more information on tutorial 4.6 Renting vs. Buying you can go to page 191 in your text.**
This concludes this blog. Remember to STUDY for the test Thursday! Have a Great Day!
Peace Brady!
Tuesday, April 14, 2009
today we learned about the advantages and disadvantages of leasing.
there are 3 main reasons people lease, rather than buy a new vehicle:
*people who like to drive a new car every few years will pay much less leasing than if they buy. they also don't have to deal with getting rid of their old car, they just turn it in at the end of the lease period.
*lease payments are usually lower than loan payments for any given car.
*leasing gives people the opportunity to drive a more expensive car than they could afford to buy.
There are 3 distinct disadvantages to leasing a car.
first, if you continually lease your cars, you will have never ending payments. if you look forward to paying off your car and owning it free and clear, don't lease.
second, if you decide to buy a car at the lease-end, you'll pay several thousands of dollars more than if you had bought initially. for example, if you buy a car, paying $500 a month for four years, you'll pay a total of $24000. you might be able to lease if for only $400 a month(total payment of $19200), but you'll probably have to pay another$8000 to keep it and if you finance that $8000 you'll pay even more.
third, most leases charge you as much as 25 cents a mile if you exceed the annual limit, usually between 12000 and 15000 miles. if you do extensive driving, leasing probably is not for you.
there are 3 main reasons people lease, rather than buy a new vehicle:
*people who like to drive a new car every few years will pay much less leasing than if they buy. they also don't have to deal with getting rid of their old car, they just turn it in at the end of the lease period.
*lease payments are usually lower than loan payments for any given car.
*leasing gives people the opportunity to drive a more expensive car than they could afford to buy.
There are 3 distinct disadvantages to leasing a car.
first, if you continually lease your cars, you will have never ending payments. if you look forward to paying off your car and owning it free and clear, don't lease.
second, if you decide to buy a car at the lease-end, you'll pay several thousands of dollars more than if you had bought initially. for example, if you buy a car, paying $500 a month for four years, you'll pay a total of $24000. you might be able to lease if for only $400 a month(total payment of $19200), but you'll probably have to pay another$8000 to keep it and if you finance that $8000 you'll pay even more.
third, most leases charge you as much as 25 cents a mile if you exceed the annual limit, usually between 12000 and 15000 miles. if you do extensive driving, leasing probably is not for you.
Friday, April 10, 2009
Wednesday, March 25, 2009
March 25, 2009
Today in Mr. Bennets class we learned how to use thie TVM solver on our calculators. The TVM solver is pretty handy and could very well be used in everyday situations. TVM stands for Time, Value of Money.
To access the TVM solver press 2nd function finance.
Then press enter on the TVM solver.
Then you should see... N ( Total number of payments)
I% ( Annual interest rate as a percent)
PV ( Present value)
PMT ( Payment each period)
FV ( Future value, or accumulated amount)
P/Y ( Number of payments per year)
C/Y ( Number of compounding periods per year)
A positive value indicates the amount is earned, and a negative value indicates the amount invested.
An example of what we did in class:
Solve for FV ( future Value)
You decide to invest $6500. the bank offers a interest rate of 8.25% compounded annually. What will your money be worth in 7 years if the interest rate remains the same?
Step 1- find the TVM solver, then fill it in
N=7
I%=8.25
PV=-6500
PMV=0
FV=0
P/Y=1
C/Y=1
Then to figure out what the future value will be you put your cursor beside FV and press ALPHA then ENTER
The right answer should be
FV=11321.62307
This means your investment will be worth $11321.62 in a total of 7 years time.
We also learned the RULE OF 72
This rule figures out how long it will take to double your money.
The formula is:
T = 72 / Annual interest rate
After we were done listening to Mr. Bennet we were assigned Page 158 in our text books.
We were to do questions #2 and #6 using the TVM solver.
To access the TVM solver press 2nd function finance.
Then press enter on the TVM solver.
Then you should see... N ( Total number of payments)
I% ( Annual interest rate as a percent)
PV ( Present value)
PMT ( Payment each period)
FV ( Future value, or accumulated amount)
P/Y ( Number of payments per year)
C/Y ( Number of compounding periods per year)
A positive value indicates the amount is earned, and a negative value indicates the amount invested.
An example of what we did in class:
Solve for FV ( future Value)
You decide to invest $6500. the bank offers a interest rate of 8.25% compounded annually. What will your money be worth in 7 years if the interest rate remains the same?
Step 1- find the TVM solver, then fill it in
N=7
I%=8.25
PV=-6500
PMV=0
FV=0
P/Y=1
C/Y=1
Then to figure out what the future value will be you put your cursor beside FV and press ALPHA then ENTER
The right answer should be
FV=11321.62307
This means your investment will be worth $11321.62 in a total of 7 years time.
We also learned the RULE OF 72
This rule figures out how long it will take to double your money.
The formula is:
T = 72 / Annual interest rate
After we were done listening to Mr. Bennet we were assigned Page 158 in our text books.
We were to do questions #2 and #6 using the TVM solver.
Wednesday, March 18, 2009
Design and measurement
Today in Math we started a new unit Design and measurement. In this unit we will each have to make a twenty mark question for our up coming test. Its pretty basic except for a couple of things.
3 feet = 1 yard 1yd^2 = 9 ft^2 12 inches in a foot. Make sure you add the taxes after your done adding up your total. When you add your taxes to your total amount you multiply your total by 1.12 because PST = 7% GST = 5%.
3 feet = 1 yard 1yd^2 = 9 ft^2 12 inches in a foot. Make sure you add the taxes after your done adding up your total. When you add your taxes to your total amount you multiply your total by 1.12 because PST = 7% GST = 5%.
Tuesday, March 17, 2009
stats test Overview
Stats overview - test is Thursday
Mean, median and mode
Frequency Table
3.1 Types of distributions – Binomial – 5 step test
Binompdf command (eg. Exactly 17/20 free throws)
Standard Deviation – Kingston and Brooks Expressways
3.2 Mean and Standard Deviation
Mean of binomial distributions μ= np
Standard deviation
3.3 Normal Distribution
68 – 95 – 99% rule
Using “exact” z-scores ±1 ±2 ±3 σ
3.4 Standard Normal Distribution
- Using z-scores
- ShadeNorm – finds the % given z-scores
InvNorm - left to right
- finds z-score given %
3.5 Normal Approximation to the Binomial Distribution
npq > 10 μ= np
ShadeNorm
3.6 Confidence Intervals μ ± 1.96σ
1-Prop Z Int
Margin of error
% margin of error.
Mean, median and mode
Frequency Table
3.1 Types of distributions – Binomial – 5 step test
Binompdf command (eg. Exactly 17/20 free throws)
Standard Deviation – Kingston and Brooks Expressways
3.2 Mean and Standard Deviation
Mean of binomial distributions μ= np
Standard deviation
3.3 Normal Distribution
68 – 95 – 99% rule
Using “exact” z-scores ±1 ±2 ±3 σ
3.4 Standard Normal Distribution
- Using z-scores
- ShadeNorm – finds the % given z-scores
InvNorm - left to right
- finds z-score given %
3.5 Normal Approximation to the Binomial Distribution
npq > 10 μ= np
ShadeNorm
3.6 Confidence Intervals μ ± 1.96σ
1-Prop Z Int
Margin of error
% margin of error.
sample video
This is a link to a sample math video. You can use this for inspiration for your bonus assignment.
Subscribe to:
Posts (Atom)