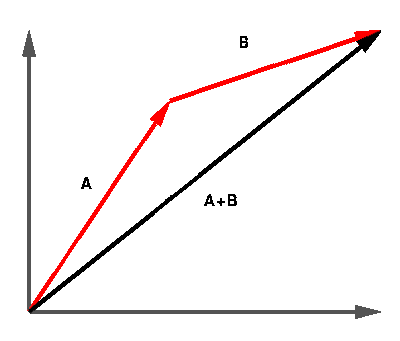
There are a number of ways to approach the sinusoidal/periodic function. We were taught to use either GRAPHMATICA or a graphing calculator.
The periodic function equation is y=Asin(Bx+C)+D and that is what you will input into the software of your choice.
A=Amplitude
B=Period (formula for period P=2(pi)/B)
C=Phase shift
D=Verticle shift
Here is a site that demonstrates those values (very usefefull to play around with it)-http://www.ronblond.com/M12/sc.APPLET/index.html
If you are given the sinusoidal function(periodic function) and want to graph it using a calculator
1. press[mode] and make sure that it is on radian NOT degrees
2. press [y=] and input the formula Asin(Bx+C)+D (substitue numbers)
3. press [graph] and behold the squiggly lines
-you may want to adjust the windows setting to get a better picture
If the information is given in tabular data then you will have to use something called SinReg
1. press [stat] and put the data into a list
2. press [stat]-> calc then go down to something called SinReg
3. back at the home screen put in SinReg,L1,L2,Y1
4. turn on the stat plot ([2nd y=]) and press graph
And that my friends is periodic functions in a nut shell.
Tuesday, June 23, 2009
Tuesday, June 2, 2009
Sequences and Series Review
Ok, this is a little late. I would use slideshare for this but, it doesn't want to work nicely. I'll just give you a download link while I fix slideshare.
Sequences and Series PPT
(Sept 10/09)
Update: The PPT link actually works out pretty well and if I were to change the Show to be nice with Slideshare I would have to change quite a bit. I'm just going to leave it the way it is.
Sequences and Series PPT
(Sept 10/09)
Update: The PPT link actually works out pretty well and if I were to change the Show to be nice with Slideshare I would have to change quite a bit. I'm just going to leave it the way it is.
Monday, June 1, 2009


OK guys were going to work with Vectors. Now it's pretty easy... A Vector is anything with a direction and a magnitude. First thing to do is draw a rough looking diagram just to show you more less what is going to look like and to make sure that your on the right track.
Some key words and phrases are:
If you know your directions your going to get this...
These are the few different directions that your going to end up getting....
Always start with the first direction you are given and go clockwise or counter clockwise in the amount of degrease you are given.
As you see the first direction it is done as i said but the second direction is a bit more tricky. When you draw you first line just draw it till the distance you need to go. For example it may say 5km when of coarse you couldn't draw it. Make a scale that makes since to the amount of space you have to draw it. 1km may be one centimeter. When you draw your second line you must imagine or draw a norther grid as the end of line and draw the second line just like the first.
If the question asks you what is the distance, "the way the crow flys" it's as simple as measuring the distance back to the staring point. If you have drawn it to scale and wrote down the right distances just use a ruler for the distance.
Some key words and phrases are:
One of the things you going to run into is a ''Bearing" a bearing will be given to you in a number, that number is the amount of degrees it is clockwise from north. For example a bearing of 90 would mean that it would straight east.
If you know your directions your going to get this...
These are the few different directions that your going to end up getting....
North of East
East of North
East of South
South of East
South of West
West of South
West of North
North of West
East of North
East of South
South of East
South of West
West of South
West of North
North of West
For example if you have "North of East" you would look at the north spot and travel East. Now to throw something else in there is going to be a number like "North 45 East"
Always start with the first direction you are given and go clockwise or counter clockwise in the amount of degrease you are given.
When your writing your question down you have to be as accurate as possible because you will be given two or more directions and have to measure the distance back...
This is Vector addition
As you see the first direction it is done as i said but the second direction is a bit more tricky. When you draw you first line just draw it till the distance you need to go. For example it may say 5km when of coarse you couldn't draw it. Make a scale that makes since to the amount of space you have to draw it. 1km may be one centimeter. When you draw your second line you must imagine or draw a norther grid as the end of line and draw the second line just like the first.
If the question asks you what is the distance, "the way the crow flys" it's as simple as measuring the distance back to the staring point. If you have drawn it to scale and wrote down the right distances just use a ruler for the distance.
Good luck...
Stats unit review, (confidence intervals)
This is a piece of the STATS unit review.
Confidence intervals.
A confidence interval is… “Predicting the likelihood that the mean of a sample occurs within a certain interval, a certain percent of the time”.
90%...95%...99%... sizes of confidence intervals considered “worthwhile” for statistical prediction purpose.
Here is an example question:
A research study on fruit flies found that an average of 50% of them stay alive after 32 hours.
a) Determine the 95% confidence interval for the percentage of a sample of 1000 fruit flies still alive after 32 hours. Show your work.
Here is what you do.
In your calculator, press the buttons… STAT then TESTS. Go to Prop z-int and it brings up this screen.
X:
N:
C-Level:
Calculate
X is your mean, N is your total number, so in this example your X would be 500, and your N would be 1000. Your C-level is 95. Press calculate and you should get this screen.
1-PropZInt
(.046901,.053099)
P=.5
N=1000
Your percentage interval is (.046901,.053099)
After every question you need to explain the meaning of the confidence interval. So in this example you would write….
If a similar experience/survey/poll were conducted this interval (46.9, 53.1) means that we are 95% confident that 32 hours later out of the 1000 fruit flies between 46,9 and 53.1 percent of them will remain alive.
I hope you are confident with this part of the unit, and if you have any questions please place them in the comments section and I will do my best to answer them.
Friday, May 29, 2009
Grouped Data
We learnt about grouping data, and ways to use use it.Grouped Data is data put into a chart or organized as a group.
As a class we did an example: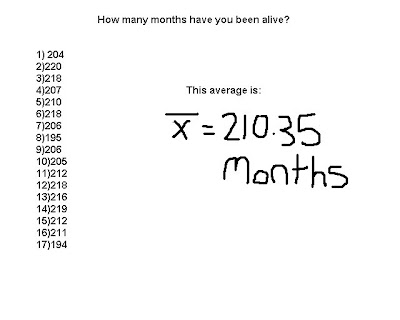 You find the average by adding up all your results from the data and divide by how many sets there are. In our example we took the sum of everything and divided by 17 to get 210.35 as an average.
There are many ways of organising data (T-chart, Venn Diagram, Etc)
Here is another way of showing our results:
You find the average by adding up all your results from the data and divide by how many sets there are. In our example we took the sum of everything and divided by 17 to get 210.35 as an average.There are many ways of organising data (T-chart, Venn Diagram, Etc)
Here is another way of showing our results:

Here we took the averages, and used tally marks to show how many of the numbers from our data fall into place of the averages. Your tally marks must add up to how many sets of numbers you have. In our Example our tally marks add up to 17.
Wednesday, May 20, 2009
Probability
Sample Space -can be defined as any complete and total representation of the outcomes in a probabaility situation.
Ex. Roll a regular 6 sided die; spin a spinner (numbered 1-4).

A'=(1-A)
A+A'=1
The definition of A is one thing or one sample. The definition of A' is everything else involved except A.

 Starting at the house CO-OP you head home but have to stop at Bob’s house to pick up your homework. You can only head South and East. How many ways can you get home from the CO-OP while stopping at Bob’s house?
Imagine encountering a problem like this…DON’T RUN AWAY IT’S EASY!!
You use Pascal’s Triangle. You first figure out the larger rectangle then the square.
You start off by adding the two ones to get 2. You then add the next one on the side and the two you just got to get three, you continue by adding the two numbers beside each other and putting their sum in the box below UNTIL you reach the red square, this is the stop point. You then start again in the new square and stop at the stop point.
You then add the two numbers that are in the red boxes, which are 126 and 6.
126+6=132
So therefore there are 132 ways to get from CO-OP to Home.

Ex. Roll a regular 6 sided die; spin a spinner (numbered 1-4).
Represent/show/display/sketch…. “The sample space”
6x4=24 possible out comes in the sample space.
6x4=24 possible out comes in the sample space.
The sample space is:
(1, Green) (1, Red) (1, Orange) (1, Blue)
(2, Green) (2, Red) (2, Orange) (2, Blue)
(3, Green) (3, Red) (3, Orange) (3, Blue)
(4, Green) (4, Red) (4, Orange) (4, Blue)
(5, Green) (5, Red) (5, Orange) (5, Blue)
(6, Green) (6, Red) (6, Orange) (6, Blue)
(1, Green) (1, Red) (1, Orange) (1, Blue)
(2, Green) (2, Red) (2, Orange) (2, Blue)
(3, Green) (3, Red) (3, Orange) (3, Blue)
(4, Green) (4, Red) (4, Orange) (4, Blue)
(5, Green) (5, Red) (5, Orange) (5, Blue)
(6, Green) (6, Red) (6, Orange) (6, Blue)
Everything and al possibilities are displayed
Mutually Exclusive and Mutually Inclusive Events
mutually exclusive events CANNOT occur together
ex:
Events A and B are mututally exclusive, they are disjoint sets. ( they have no common members)
The following formula is the only formula to be used with mutually exclusive events ONLY!
P(A or B)= P(A) + P(B)
ex: What is the probability in a regular deck, on a single card flip, of drawing a face card or a 5?
A: face card
B: 5
P(A or B)= P(A)+P(B)
P(f or 5)=P(f)+P(5)
P(f or 5)=P(f)+P(5)
=12/52+4/52
=16/52
=4/13 or 31%
=16/52
=4/13 or 31%
Mutually inclusive events DO happen together
ex:
A:face card- 12/52
B: red cards-26/52
B: red cards-26/52
38/52 is WRONG
because you cannot count them twice!!
the correct way to do this is:
P(AorB)=P(a)+P(B)-P(A and B)
=12/52+26/52-6/5
=32/52 or 8/13 or 61.5%'
*use venn diagrams* put examples of mutually inclusive and exclusive events venn diagrams
the above are venn diagrams of the two examples given earlier.
-------------------------------------------------------------------------------------------------------------------------------------------------------------------------------------------------
INDEPENDENT/DEPENDENT EVENTS
*involves chronology of events(order in time)
Independent events do NOT have an effect on each other (ie. successive coin flips)these events are random.
Dependent events do have an impact on some subsequent probability event (ie. newest thing Depends on an older thing) these are not random.
example of dependent events
ex: "with or without replacement"
socks from a drawer
balls from an urn
Take for example the famous game off of "The Price Is Right" 3-Strikes game.
Fundamental Counting Principle:
When order doesn’t matter you use nCr. You enter the first number (number of letters in the alphabet, number of 5 cards poker hands, etc…), press math, PBR, nCr, the second number (the number of letter code words/the number of diamonds and hearts, etc…).
When order does matter you use nPr. You enter the first number (number of letters in the alphabet, number of 5 cards poker hands, etc…), press math, PBR, nPr, the second number (the number of letter code words/the number of diamonds and hearts, etc…).
A'=(1-A)
A+A'=1
The definition of A is one thing or one sample. The definition of A' is everything else involved except A.
Pascal's Triangle:
Starting at the house CO-OP you head home but have to stop at Bob’s house to pick up your homework. You can only head South and East. How many ways can you get home from the CO-OP while stopping at Bob’s house?Imagine encountering a problem like this…DON’T RUN AWAY IT’S EASY!!
You use Pascal’s Triangle. You first figure out the larger rectangle then the square.
You start off by adding the two ones to get 2. You then add the next one on the side and the two you just got to get three, you continue by adding the two numbers beside each other and putting their sum in the box below UNTIL you reach the red square, this is the stop point. You then start again in the new square and stop at the stop point.
You then add the two numbers that are in the red boxes, which are 126 and 6.
126+6=132
So therefore there are 132 ways to get from CO-OP to Home.
Monday, May 4, 2009
Design and Measurement
For our class assignment my group is in charge of Design and Measurement so hear it is.
In the Design and Measurement unit every thing was pretty straight forward. Basically all that you had to do was multiply the amount of material that you were using and multiply it by the price of the material, or if your looking for how much material there is left over you subtract how much you use by the total material used. Vice versa if your looking for how much material you used.
Here is an example.
A ballpark is to be built according to the following diagram.
A fence is to be put up around the entire park.
Fencing costs $1.35 per running foot.
The infield area that is to have shale on it needs to be dug down 18"(inches) so that one foot of gravel can be put down as a base and the 6"(inches) of shale put on top.
The cost of excavation is $9.00 per cubic yard.
Gravel costs $7.00 per cubic yard and shale costs $9.50 per cubic yard.
The remaining area of the park needs to have 4"(inches) of topsoil on it and sod put on top of the soil.
Topsoil costs $20 per cubic yard and sod costs $1.25 per square foot.
The grass needs to have fertilizer as soon as it is laid.
The fertilizer costs $15.60 per bag and a bag will cover 75 square yards.
Find the total cost of this project.
P.S.T. at 7% and G.S.T. at 5% apply to all materials used. Only G.S.T. applies to the excavation cost.

Start off by finding the area of the entire park, the infield and outfield, this will save you some time later on.
Area of entire ballpark is Area=Pi r^2 (Pi radius squared)
=Pi 240^2
=180955.7 /4 = 45238.9 feet square
Area or infield is Area=Pi r^2 (Pi radius squared)
=Pi 125^2
=49238.4 /4 = 12271.85 feet square
You have to divide these two answers by 4 because you are finding the area of an entire circle and you only want the area of a quarter the entire circle.
To find the outfield area subtract the infield are from the entire ballpark area.
45238.9 - 12271.85 = 32967.05 feet square
Now we can start figuring out the cost of the park.
Cost of Fence- Perimeter = 2Pi r
= 2Pi 240
= 1508 /4 = 377 + 2(240) = 857 * $1.35 = $1156.95
Cost of infield
Excavation- Cost = 1.5 * 12271.85 /27 = 681.8 * $9.00 = $6136
When finding the cost of something that is in yards we need to divide by 27 because the area we found is in feet.
Cost of Shale- Cost = 1/2 foot or .5 * 12271.85 = 227.3 * $9.50 = $2159.35
Cost of Gravel- Cost = (1 foot or 1 * 12271.85) /27 = 454.51 * $7 = $3181.57
Cost of Topsoil- Cost = (4 inches/12 inches * 32967.10) /27 = 407 * $20 = $8140
Cost of Sod- Cost = 32967.10 * $1.25 = $41208.88
Cost of Fertilizer- Cost = 32967.10 /27 /75 = 16.3 * $15.60 = $254.30
Now add up all of the purple prices to get a total of $56101.05
Now find the total excavation cost tax included. $6136 * 1.05 = $6442.8
Then find the total material cost plus tax. $56101.05 * 1.12 = $62833.18
Finally add the two totals in red to get your final total of $69275.98
Thursday, April 30, 2009
today we did some math stuff. we learned about half-life and maintenance level. half-life is half the time for half the substance to be gone. maintenance level is when a person ingests a substance at regular time intervals, the amount of the substance in the blood eventually levels off, of stabilizes.
Tuesday, April 28, 2009
using microsoft excel for sequences
today in class we used a program called microsoft Excel. it was an easier way to find out the answer for sequences in a faster manner. you type in the first couple formulas and titles and from your specific question. ex. =b2*2 or =C2+.5. then scroll to the bottom to find the answer for the specific number your looking for.
Monday, April 27, 2009
today we learned about sequences
sequences are very exciting and fun to do
there are 2 different kinds of sequences
arithmatic sequences are found by adding or subtracting a common number ex: 2,4,6,8
geometric sequences are found by multiplying a common ratio
ex: 2,4,8,16
a recursive formula is based on the preceding term
the formula is tn=tn-1x2
nMin=1st term
u(n)=formula
u(mim)=value of first term
on the calculator
Friday, April 24, 2009
Tuesday, April 21, 2009
Monday, April 20, 2009
Hello Everyone,
I would like to start off by stating that we have a test on Personal Finance on, Thursday April 23rd, 2009. So Study Study Study!!
~***Personal Finance Review***~
4.1 Investing Money
Use compound interest formula
Use two spreadsheets
Use TVM Solver
Rule of 72
4.2 Investing for the Future
What is an RRSP – how does it work?
Use spreadsheets created
4.3 Investment Portfolios
Types of investments
Strategies based on age – not complex
4.4 Leasing
Residual values
Use LEASEBUY spreadsheets
4.5 Mortgages
Basic terminology- amortization period, term, rate, semi-annual(2)
Use TVM solver to calculate payments
4.6 Renting vs. Buying
Use RENTBUY spreadsheet – corrections
Advantages & Disadvantages of Renting & Buying a House.
*** Using TVM Solver***
N: Total Number of payments
I%: annual interest rate as a percent
PV: present value
PMT: payment each period
FV: future value, or accumulated amount
P/Y: number of payments per year
C/Y: number of compounding per year.
TVM Question [Example]
1. Solve for FV (future value)
You decide to invest $6500. The bank offers an interest rate of 8.25% compounded annually. What will your money be worth in 7 years if the interest rate remains unchanged?
N=7 N=7
I%=8.25 I%= 8.25
PV= -6500 PV= -6500
PMT=0 PMT= 0
FV=0 FV= 11321.62307
P/Y=1 P/Y= 1
C/Y=1 C/Y= 1
**It shows that in 7 years your money will be worth $11321.62.**
{*For More Review You Can Go To Page 201 In Your Text**}
Today in class we learned about tutorial 4.6 Renting vs. Buying. We learned about Advantages and Disadvantages of Renting and Buying.
Here are some Advantages and Disadvantages of Renting or Buying a house.
Advantage Disadvantage
Renting : Not locked In Not Your Own
Cheaper Can Not Renovate
Short- Term Money Down the DrainI would like to start off by stating that we have a test on Personal Finance on, Thursday April 23rd, 2009. So Study Study Study!!
~***Personal Finance Review***~
4.1 Investing Money
Use compound interest formula
Use two spreadsheets
Use TVM Solver
Rule of 72
4.2 Investing for the Future
What is an RRSP – how does it work?
Use spreadsheets created
4.3 Investment Portfolios
Types of investments
Strategies based on age – not complex
4.4 Leasing
Residual values
Use LEASEBUY spreadsheets
4.5 Mortgages
Basic terminology- amortization period, term, rate, semi-annual(2)
Use TVM solver to calculate payments
4.6 Renting vs. Buying
Use RENTBUY spreadsheet – corrections
Advantages & Disadvantages of Renting & Buying a House.
*** Using TVM Solver***
N: Total Number of payments
I%: annual interest rate as a percent
PV: present value
PMT: payment each period
FV: future value, or accumulated amount
P/Y: number of payments per year
C/Y: number of compounding per year.
TVM Question [Example]
1. Solve for FV (future value)
You decide to invest $6500. The bank offers an interest rate of 8.25% compounded annually. What will your money be worth in 7 years if the interest rate remains unchanged?
N=7 N=7
I%=8.25 I%= 8.25
PV= -6500 PV= -6500
PMT=0 PMT= 0
FV=0 FV= 11321.62307
P/Y=1 P/Y= 1
C/Y=1 C/Y= 1
**It shows that in 7 years your money will be worth $11321.62.**
{*For More Review You Can Go To Page 201 In Your Text**}
Today in class we learned about tutorial 4.6 Renting vs. Buying. We learned about Advantages and Disadvantages of Renting and Buying.
Here are some Advantages and Disadvantages of Renting or Buying a house.
Advantage Disadvantage
Renting : Not locked In Not Your Own
Cheaper Can Not Renovate
No Pets/ No Parties:(
Buying: Your Own Locked In
You Can Do Whaterver You Want Monthly Mortgage and Other Bills
Long-Term
Expensevi
This may come in handy to those graduating and moving next year. This may also help you when it comes to renting a house.
**For more information on tutorial 4.6 Renting vs. Buying you can go to page 191 in your text.**
This concludes this blog. Remember to STUDY for the test Thursday! Have a Great Day!
Peace Brady!
Tuesday, April 14, 2009
today we learned about the advantages and disadvantages of leasing.
there are 3 main reasons people lease, rather than buy a new vehicle:
*people who like to drive a new car every few years will pay much less leasing than if they buy. they also don't have to deal with getting rid of their old car, they just turn it in at the end of the lease period.
*lease payments are usually lower than loan payments for any given car.
*leasing gives people the opportunity to drive a more expensive car than they could afford to buy.
There are 3 distinct disadvantages to leasing a car.
first, if you continually lease your cars, you will have never ending payments. if you look forward to paying off your car and owning it free and clear, don't lease.
second, if you decide to buy a car at the lease-end, you'll pay several thousands of dollars more than if you had bought initially. for example, if you buy a car, paying $500 a month for four years, you'll pay a total of $24000. you might be able to lease if for only $400 a month(total payment of $19200), but you'll probably have to pay another$8000 to keep it and if you finance that $8000 you'll pay even more.
third, most leases charge you as much as 25 cents a mile if you exceed the annual limit, usually between 12000 and 15000 miles. if you do extensive driving, leasing probably is not for you.
Friday, April 10, 2009
Wednesday, March 25, 2009
March 25, 2009
Today in Mr. Bennets class we learned how to use thie TVM solver on our calculators. The TVM solver is pretty handy and could very well be used in everyday situations. TVM stands for Time, Value of Money.
To access the TVM solver press 2nd function finance.
Then press enter on the TVM solver.
Then you should see... N ( Total number of payments)
I% ( Annual interest rate as a percent)
PV ( Present value)
PMT ( Payment each period)
FV ( Future value, or accumulated amount)
P/Y ( Number of payments per year)
C/Y ( Number of compounding periods per year)
A positive value indicates the amount is earned, and a negative value indicates the amount invested.
An example of what we did in class:
Solve for FV ( future Value)
You decide to invest $6500. the bank offers a interest rate of 8.25% compounded annually. What will your money be worth in 7 years if the interest rate remains the same?
Step 1- find the TVM solver, then fill it in
N=7
I%=8.25
PV=-6500
PMV=0
FV=0
P/Y=1
C/Y=1
Then to figure out what the future value will be you put your cursor beside FV and press ALPHA then ENTER
The right answer should be
FV=11321.62307
This means your investment will be worth $11321.62 in a total of 7 years time.
We also learned the RULE OF 72
This rule figures out how long it will take to double your money.
The formula is:
T = 72 / Annual interest rate
After we were done listening to Mr. Bennet we were assigned Page 158 in our text books.
We were to do questions #2 and #6 using the TVM solver.
Wednesday, March 18, 2009
Design and measurement
Today in Math we started a new unit Design and measurement. In this unit we will each have to make a twenty mark question for our up coming test. Its pretty basic except for a couple of things.
3 feet = 1 yard 1yd^2 = 9 ft^2 12 inches in a foot. Make sure you add the taxes after your done adding up your total. When you add your taxes to your total amount you multiply your total by 1.12 because PST = 7% GST = 5%.
3 feet = 1 yard 1yd^2 = 9 ft^2 12 inches in a foot. Make sure you add the taxes after your done adding up your total. When you add your taxes to your total amount you multiply your total by 1.12 because PST = 7% GST = 5%.
Tuesday, March 17, 2009
stats test Overview
Stats overview - test is Thursday
Mean, median and mode
Frequency Table
3.1 Types of distributions – Binomial – 5 step test
Binompdf command (eg. Exactly 17/20 free throws)
Standard Deviation – Kingston and Brooks Expressways
3.2 Mean and Standard Deviation
Mean of binomial distributions μ= np
Standard deviation
3.3 Normal Distribution
68 – 95 – 99% rule
Using “exact” z-scores ±1 ±2 ±3 σ
3.4 Standard Normal Distribution
- Using z-scores
- ShadeNorm – finds the % given z-scores
InvNorm - left to right
- finds z-score given %
3.5 Normal Approximation to the Binomial Distribution
npq > 10 μ= np
ShadeNorm
3.6 Confidence Intervals μ ± 1.96σ
1-Prop Z Int
Margin of error
% margin of error.
sample video
This is a link to a sample math video. You can use this for inspiration for your bonus assignment.
Monday, March 16, 2009
Today we learned how to do confidence intervals. an important formula is mu plus or minus 1.96(standard deviation). thats how you get your confidence interval. They would use this kind of stuff in surveys. It is alot easier to do on the calculator. We are having our stats unit test this Thursday but Nick will write in on Wednesday.
Friday, March 13, 2009
hi how do you do digital friends? Here ya go...
today we are on tutorial 3.5 on page 126 in our little math book and this unit we are learning the normal approximation to a binomial distribution. here is some things we have learned on Friday the 13th.
The bigger the value of n the harder the binompdf and the closer the normal approximation is to the correct value.
Rule: if N P Q is greater than 10 then use the normal approximation to the binomial distribution.
P129
example
n= 650
p=.048
q=.952 100%-4.8%=95.2%
npq 650(.048)(.952)=29.7>10 its OK! guys
mean=650(.048)=31.2
standard deviation= square npq square 29.7=5.45
z=x-m/standard deviation 30-31.2/5.45=-.22
draw the graph
shade norm(-.22,5)= .587=58.7%
how did we do it?
here we go!
step 1: determine npq *remember q=1-p
step 2: determine if npq is bigger than 10
step 3: determine mean and standard deviation * remember mean = np
and standard deviation = square npq
step 4: calculate appropriate z score * remember z=x-m/standard deviation
step 5: just draw the graph
step 6: use shade norm appropriately
thats all remember to do page 1-8 on page # 130
holla
Thursday, March 12, 2009
March 12/2009
Today In class we started off with some mental math. After that we went over vector question #7 from exercise 3.
He then showed us how to print from Euclid, by pushing the prtSc button which is on the top of the key board, then you open up word and right click and paste your picture, and she's ready to print.
We then did a vector question that we handed in for marks . The question was, Diver on ocean floor, walking 40m in a direction w37 degree's followed by another walk measured 25m at a 130 degree bearing calculate Resultant? We then went over the question and the answer was, the resultant vector is 42.09m, in a direction 18 degrees west of south.
Hello all fello math students! Its Courtney here, reporting to you on this fine Thursday morning. I can't beleive tomorrow is Friday already, not to mention Friday the 13th! Look out!
Today, Mr. Bennet was in a dandy mood and gifted us with a work period, but of course there is always a catch! We have to show him what we have accomplished through out the class and what we have learned. At the beginning of class, Mr. Bennet handed out our Statistics unit project titled "Quality Control in the Manufacturing Industry". He also handed out an old statistics test for review, so we can study for the test coming up on either Wednesday or Thursday of next week.
Since I got to put down a question plus the answer, I'll give ya all a head start on the statistics review test! ;)
1. The following data represents the time spent in a doctor's waiting room in minutes.
2.5 12.5 15 3 4.5
13 16 10 6 9
10.5 11 15 5 15.5
15 20 35 11 15
6 10 25 3.5 9
8 15 20 5 7
Find the mean and standard deviation of the data. Is the data normally distributed? Justify your answer with your knowledge of the normal curve.
*Enter All in L1 in graphing calculator
Stat Calc
1 Var Stats L1
Mean= 11.8
Standard Deviation= 6.93
+-/ 1 Standard deviation = 11.8 +- 6.93= 4.87 -> 18.73
how many between?
22/30= 73%
+-/ 2 Standard deviation = 11.8 + 2 (6.93) = -2.06 -> 25.66
how many between?
all red 29/30 = 97%
[Almost follows 68, 95, 99% Rule, Some what normal.]
And there you have it! Well Im out, I gots lots of work to do! :)
Keep it Real...
Courtney
Wednesday, March 11, 2009
March 11th Lesson
Helllo! well today in class we learned alot..... ha.
today we learned about Percentiles and what they are used for and do.
Example 1: 80 percentile
--> Means that you are better than 80% of the population
Example 2: 100% percentile
--> Means you are 100% the BEST! whoo
We had also learned about Invert Norm which is the opposide of shade norm.
*Given the shaded area, invert norm returns or gives back the z score that would shade that are.
..Do you understand?
*Shade Norm you know the z-score and want to know the percent%
*Invert Norm you know the percent% and want to know the z score
To find Shade Norm on your calculator you hit:
2nd DISTR -> DRAW 1:ShadeNorm(
To find Invert Norm on your calculation you hit:
2nd DISTR 3: invNorm(
Today for work we got a hand out called excercises standard normal distributions and were to do numbers 1-15 and also got another hand out called invert norm questions and were to do numbers 1-6.
well thats it for today.. peace
Heey Everyone,
Here are some ways to better understand Binomial Distribution,
For a Binomial Distribution
Here are some ways to better understand Binomial Distribution,
For a Binomial Distribution
- m= mean
- n = number of trials
- p= probability of sucess
- q= probability of fail
- σ = standard deviation
- √= square root
- m=np
- σ=√npq
- q= 1-p
[**For extra work on Binomial Distribution you can go to page. 108 in your textbook**]
Talk To You Later,
Brady*
Tuesday, March 10, 2009
today in class i fell asleep again so my blogs gonna be bad and i dont like constructive sentences we learned about standard normal distribution tutorial 3-4 the formula is z=x-mew over sigma the calculator comes in useful in this unit so remember to not leave it at home like i did the steps are
1 2nd function distribution
2 draw_ shade norm it always goes left to right
3 type in the numbers put brackets in the right place
4 write down the answer
if there are two shaded areas you need to find add them up to get the answer
1 2nd function distribution
2 draw_ shade norm it always goes left to right
3 type in the numbers put brackets in the right place
4 write down the answer
if there are two shaded areas you need to find add them up to get the answer
Monday, March 9, 2009
3-3
Greetings, to whomever actually happens to be reading this
Today, to the best of my understanding, we learned about standard deviation. A majority of the examples and work we accomplished pertained to the 68-95-99% Rule. The first standard deviation contains 68% of data. 95% of data is within two standard deviations of the mean, and 99.7% is within 3 standard deviations.
This is a very vague description. For futher inquiry, as well as assigned homework, see PAGE 116 QUESTIONS #1-9
Friday, March 6, 2009
tutorial 3-2
hey everybody its icy today here..
today we were learning how to find the mean and standard deviation of a binomial distribution which looks like this
n*p=m binomial distribution
in stead of going threw the whole binompdf on the graphing calculator you can simply find the n which stands for number of trails the p which is the probability of success once you have found be you can find q which is q=1-p in order to find the strandard deviation you just plug in the numbers to this formula
squareroute of npq
so it would look like this in an example
squareroute (300)(.028)(.972) and that willl give you your stand deviation
to find the mean of abinomial distribution you find n and p and multiply them
we were assigned to do page 108 questions 1-6,8 from our text books for work plus a couple of worksheets to get a better understanding of all of this
Thursday, March 5, 2009
Sup Yo!
Yesterday we learned Distributions 3.1! We learned about Probabitlity Distribution, Uniform Distribution, A Binomial Experiment and also A Binomial Distribution.
**Probability Distribution: gives the theoretical probability for each outcome of an experiment. it can be displayed as a table or as a graph. Here are two important properties of probability distribution.
1. the probabilities are between 0 and 1.
2. the sum of the probabilities is always 1.
**Uniform Distribution: is a probability distribution in which the probabilities are all equal. For example, an experimen consists of tossing a single 6 - sided die and noting the number on the face of the die.
** Binomial Experiment: has a fixed number of independant trials in which the outcomes can be classified as a sucess or failures.
** Binomial Distribution: is the probability distribution for a binomial experiment.
*We learned the steps on our calculator to calculate and graph binomial distribution!
have a good day...
peace out,
Brady!
Wednesday, March 4, 2009
Matrices 4
Continuing the experiment, try to watch it sometime!
This video is about Network Matrices!
also the song was made on GarageBand!!!
Enjoy,
Nemo
Matrices 3
Little experiment, try to watch it sometime!
This video is about Transition Matrices!
also the song was made on GarageBand!!!
Enjoy,
Nemo
Tuesday, March 3, 2009
Steps to use TI 83 for mode,median and mean
1. turn on your calculator
2. Stat, Edit and punch in your data in L1 or L2 and so on.....
3. 2nd Quit, Stat, Calculate, 1-Var Stats
4.Punch in your L1, use comma ( , ) if you need to then press enter
5. write down your mode and median or what ever data you need from the screen.
2. Stat, Edit and punch in your data in L1 or L2 and so on.....
3. 2nd Quit, Stat, Calculate, 1-Var Stats
4.Punch in your L1, use comma ( , ) if you need to then press enter
5. write down your mode and median or what ever data you need from the screen.
Friday, February 27, 2009
Matrices 2: Armageddon!!!! (multiplying)
Alright, I'm Nemo, Silvers partner in crime. We're are doing our blog project, for the SVRSS Gr. 12 Applied math program.
Okeey-Dokeey, Lets get started. Multiplying Matrices. This is different then Scalar Multiplying. Instead of multiplying each number inside the matrix by a set number, things are done a bit differently. Let me show you.
1.

2.

3.

Okeey-Dokeey, Lets get started. Multiplying Matrices. This is different then Scalar Multiplying. Instead of multiplying each number inside the matrix by a set number, things are done a bit differently. Let me show you.
1.
2.
3.
4.

Alright, I'll be referring to the pictures in the next little bit, so I numbered them.
When you are first going to multiply a matrix, you must know whether the matrices can by multiplied together of not. Here is how you know,
"The Number of Rows in the second matrix must match the Number
of Columns in the first Matrix"
as told in image 1. Which means, If you have matrix [A](2x2) and matrix [B](4x2) you cannot multiply [A]x[B] Because the row in [B](4) doesn't match the column in [A](2). But you can multiply [B]x[A] Because the row in [A](2) matches the column in [B](2).
Now for the Second part of image 1.
"The dimensions of the Product matrix are : The # of Rows in the First
matrix X The # of Columns in the Second Matrix."
This means that when we multiply [B]x[A], the end product will equal 4x2.
All of what I just said is in a more visual form on image 2.
Now, the next little bit I'm going to tell you should be known, but you don't need it since your calculator does it for you. Mr. Maksymchuk recommends that you NEVER do it by hand, at least when you have a calculator to do it. But I will show how to do by hand anyways, just so you know how it works.
Referring to image 3, we are going to learn the Two finger rule. You multiply the first row of the first matrix, by the first column of the second matrix(a x e and b x g) You then add the products of those and add them together for the first number in our product matrix. For the second number move over to the second column in the second matrix. Then the second row in the first matrix and the first column in the second matrix, so on and so forth.
Image 4 is where all we have learned in image 3 comes into play, and is used. There is a screen shot as to prove that is done right.
Remember, we shouldn't have to use the two finger method if we have a calculator.
And that is how multiplying matrices by matrices work.
Thanks for your time
Nemo
Here's Matricies For Ya
Hi, I'm Silver, nice to meet you. I hope you are all well.
 This page that was given to my class by Mr.Maksymchuck just means what I said.... with a break-out of colors.
I am working with Nemo, to help teach you about matrices. As this is the first time this is being done (our schools doing this blog) I hope it works well, and does help our classes.
I am going to try to teach you how to ADD, SUBTRACT, and SCALAR MULTIPLY matrices, by telling you the rules and conditions that must be followed to either add, subtract or multiply the matrices. I will also give you examples that was given to my class to help explain what I am trying to tell you.
Now, I will start with ADDING the matrices.
Now, I will start with ADDING the matrices.
To Add matrices they must have the same dimensions, meaning they must have the same amount of rows and columns.
 This page that was given to my class by Mr.Maksymchuck just means what I said.... with a break-out of colors.
To simplify this color explosion, it tells us, if we look at matrix A and matrix B, that "0" can be added to "4", "1" can be added to "5", "2" can be added to"6", and "3" can be added to"7".
The result of which will be matrix C that would be:
[4 6]
[8 10]
[8 10]
As another example:
A [2x4] matrix can be added to another [2x4] matrix.
However, a [2x5] matrix cannot be added to a [3x6]matrix.
Now that I tried to explain ADDING matrices, I will now try to explain how to SUBTRACT them.
Now that I tried to explain ADDING matrices, I will now try to explain how to SUBTRACT them.
Subtracting matrices should be easily understood, so long as you know how to ADD matrices. I say it is easy because it follows the same rule, or the same condition as ADDING. "The dimensions must be the same."
For example:
A [5x5] matrix can be SUBTRACTED by another [5x5] matrix, exactly like matrices with these dimensions can be ADDED.
Next up is MULTIPLYING matrices. Now there are two kinds of multiplying, but I will teach you about one kind, SCALAR MULTIPLYING.
With SCALAR MULTIPLYING the whole matrix is multiplied by the SCALAR NUMBER.

This burst of color just explains that any matrix be it a [1x1], [2x10], or even bigger (any sized) matrix can be multiplied by any size of a scalar number.
The definition says that it is just a number, or just a value, that it doesn't give a direction.
Thursday, February 26, 2009
Wednesday, February 25, 2009
blog thing
today we learned about solving transition problems using matrices
the formula is Pn=Po x Tn
Po is the initial probability matrix and must be a row ex: [.5 .5]
to calculate probabilities for subsequent matrices we need to create a transition matrix
T is the transition matrix and must be a square ex: [.64 .35
.3 .7 ]
the numbers must be in decimal format cuz your dealing with percentages
we had to work on page 83 in the book # 1-9 but not 2
test on Friday
Tuesday, February 24, 2009
Today was a work period. We worked on old exam questions.

 Richard needs some school supplies. In the following matrix, he compares the cost ($)
per package for the same three items from three different stores. These costs do not
include taxes.
store X store Y store Z
pencils 1.59 1.89 1.69
A= pens 1.79 1.49 1.99
notebooks 2.09 1.69 1.79
a) Calculate the cost per package including taxes. Show your work using matrix
operations. (GST = 6%, PST = 7%)
A x 1.13= 1.80 2.14 1.91
2.02 1.68 2.29
2.36 1.91 2.02
b) If Richard needs 2 packages of pencils, 1 package of pens, and 5 packages of
notebooks, at which store should he shop to get the lowest price? Show your work
using matrix operations.
1.80 2.14 1.91 storeX storeY storeZ
[2 1 5] x 2.02 1.68 2.29 = [17.42 15.51 16.22]
2.36 1.91 2.02
He should shop at store Y.
here's the link if you want:
http://www.edu.gov.mb.ca/k12/assess/archives/ap_mg_june_08.pdf
Richard needs some school supplies. In the following matrix, he compares the cost ($)per package for the same three items from three different stores. These costs do not
include taxes.
store X store Y store Z
pencils 1.59 1.89 1.69
A= pens 1.79 1.49 1.99
notebooks 2.09 1.69 1.79
a) Calculate the cost per package including taxes. Show your work using matrix
operations. (GST = 6%, PST = 7%)
A x 1.13= 1.80 2.14 1.91
2.02 1.68 2.29
2.36 1.91 2.02
b) If Richard needs 2 packages of pencils, 1 package of pens, and 5 packages of
notebooks, at which store should he shop to get the lowest price? Show your work
using matrix operations.
1.80 2.14 1.91 storeX storeY storeZ
[2 1 5] x 2.02 1.68 2.29 = [17.42 15.51 16.22]
2.36 1.91 2.02
He should shop at store Y.
here's the link if you want:
http://www.edu.gov.mb.ca/k12/assess/archives/ap_mg_june_08.pdf
Today we learned how to solve route matrices. We had a work period to do questions 1-6 on page 76 in our textbook. some important things to remember is that A means 0 stopovers, A squared means 1 stopover, A cubed means 2 stopovers and so on. A + A squared = 0-1 stopovers, A + A cubed means 0-2 stopovers. Some examples of route matrices would be the different routes you could take from Toronto to Vancouver via plane, or who can contact who in a spy network.
Thursday, February 19, 2009
February 19th Math Blog*
Hello...
Today at the DRCSS we did Tutorial 2.2- Multiplying Matrices..
When multiplying a Matrice, multiply the first number in the row by the first number in the column.. then multiply the second number in the row by the second number in the column.. and so on then add the products.
** Two matrices, A & B, can be multiplied to form A X B only if:
Example: Amxn X Bnxp = ABmxp
--->> m,m are dimentions of product matrix.
--->> n,n must be equal.
*When you multiply matrices, AxB doesn't necessarily equal BxA
For today's assignment we had done questions 1,2,3,4, and your choice of either 5 or 6, on Page 64.
Today at the DRCSS we did Tutorial 2.2- Multiplying Matrices..
When multiplying a Matrice, multiply the first number in the row by the first number in the column.. then multiply the second number in the row by the second number in the column.. and so on then add the products.
** Two matrices, A & B, can be multiplied to form A X B only if:
- The Number of columns in A = The number if rows in B
Example: Amxn X Bnxp = ABmxp
--->> m,m are dimentions of product matrix.
--->> n,n must be equal.
*When you multiply matrices, AxB doesn't necessarily equal BxA
For today's assignment we had done questions 1,2,3,4, and your choice of either 5 or 6, on Page 64.
Wednesday, February 18, 2009
Hey everybody, how ya'll doin?! It's Courtney here and today is February 18 and it is chilly outside, about -20 without the wind blowing. Sure beats -50 though right! Are the roads still pretty icey out there? Not going to lie, I was scared to even get into a vehicle for a while there.
We had fun in math class today learning about our new unit on tutorial 2.1 Matrix Operations on page 52 in our handy dandy applied 12 textbook!
A matrix is a rectangular array of numbers, known as the elements of the matrix. The array is enclosed within square brackets. Each element is a scalar in this unit.
The brackets are very important, so do not forget to put them in! Also, the row number always comes before the column number. This unit is mainly done on the graphic calculator, so it is probably a good idea to get out there and get one and remember to get four triple A batteries!
Mr.Bennet assigned homework on page 55 numbers 1,3,4,5,7,8! Holy Macaroni, you better get started you guys!
Well my time on here has come to an end, but I can promise you I will be back! Nice meeting you :)
Keep it real,
Courtney
Wednesday, February 11, 2009
Getting To Know You....(isn't that a famous song by someone my parent's age?)
What's the weather like in Dauphin? How about the highways? Buses run today? Consider this a shout out trying to discuss things other than Probability / Matrix Modelling.....The way I see it, we should 'break the ice', somehow, although in light of recent weather phenomena, maybe it's best to just say hello to each other....
So, Hello!
RM
So, Hello!
RM
February 11, 2009 D.R.C.S.S
Today at the D.R.C.S.S we did tutorial 1.4 on probability in our text books. We also learner about Independent and Dependent events.
Example: What is the probability that a coin will land heads in each of 4 consecutive tosses?
P(4 heads in a row) = 1/2 x 1/2 x 1/2 x 1/2
= 1/16
The probability of tossing 4 heads is 1/16.
Example: What is the probability that a coin will land heads in each of 4 consecutive tosses?
P(4 heads in a row) = 1/2 x 1/2 x 1/2 x 1/2
= 1/16
The probability of tossing 4 heads is 1/16.
Tuesday, February 10, 2009
What I Think I'm Supposed To Have Learned...or Mentoring 101
At the end of our section on Matrix Modelling, I am confident (no, really, I AM confident), that my students here in Swan River will be more than capable of teaching their peers in Dauphin some of the finer points regarding what we've covered so far.
Specifically, what they'll be doing (or what you'll be doing, if you happen to be unfortunate enough to have landed on my class list this semester), is this:
photo credit: http://www.svleck.com/images/helping%20students%20stat.png

1. In your Blog Team, begin a series of posts describing the 'ins and outs' of one sub-topic in the unit on Matrix Modelling. I'll tell you in class who your team is, and what your sub-topics are.
2. Your language is critical to the success of such an experiment. You need to talk on the blog like a high school student speaking with another high school student (whom you don't know), since that is exactly the situation that we're in. Grammar, spelling, and punctuation are really important, since you don't know whom you're speaking to, and the only thing that they have to base the quality of your instruction on is your language....Having said that, I think a sense of humour is really worthwhile, as is the sense that the world is much larger than our small piece of geography in the Parkland...
3. I hope that it's obvious that I expect you to post screen shots, recordings, external links, etc....including anything and everything that might help the students in Dauphin learn what you're supposed to know...Be creative, and think carefully about what you're posting...
Rationale: Am I expecting my students to 'create' learning opportunities for other students in other communities, just because? Believe it or not, I'm not really that crazy about 'busy work'....Teachers as well as students are busy, and need to trust that their time is well spent in learning environments/opportunities....So here's my take...(and I take absolutely no credit for this idea, it's just 'common' knowledge, especially to first-year teachers)....
"Having to teach something to someone else
makes you learn it yourself, really, really, well...."
....which I hope does a quick job of explaining at least one of the reasons why we're doing what we're doing....
RM
Thursday, February 5, 2009
Tuesday, February 3, 2009
And another chapter begins...
So Mr. Bennet and I have schemed a bit to 'open up our world' a little with respect to the idea that our students need to be exposed to some different things with regard to online learning.
We thought (actually, it was mostly Mr. Bennet's idea, but I'll happily agree with ideas that aren't mine and that I believe are worthwhile....) that we would create a blog populated by authors from each of our respective classes in Grade 12 Applied Math. So here we are.
Yes, this is new....
Yes, this is a little experimental....

photo credit: www.fotosearch.com/comstock/oddballs/CSK161/
No, we've never done this before...
No, we're not really sure how it's exactly going to turn out...
I am, personally, by nature, at least somewhat optimistic generally about new things. I'm excited about learning from and with new people, and I believe as a teacher that I owe it to my students to explore and learn with them. Let's keep our minds open, and let's keep track of the things we do well to share with others, and also the things we need to improve upon to help future students and teachers embarking on similar journeys....
Here in my school, our semester starts tomorrow, so I'll meet my students then....
Any thoughts, Mr. Bennet???
(or comments?)
Subscribe to:
Posts (Atom)