As a class we did an example: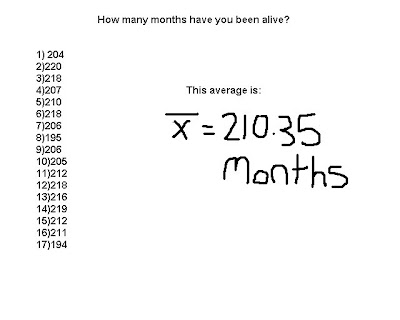 You find the average by adding up all your results from the data and divide by how many sets there are. In our example we took the sum of everything and divided by 17 to get 210.35 as an average.
There are many ways of organising data (T-chart, Venn Diagram, Etc)
Here is another way of showing our results:
You find the average by adding up all your results from the data and divide by how many sets there are. In our example we took the sum of everything and divided by 17 to get 210.35 as an average.There are many ways of organising data (T-chart, Venn Diagram, Etc)
Here is another way of showing our results:

Here we took the averages, and used tally marks to show how many of the numbers from our data fall into place of the averages. Your tally marks must add up to how many sets of numbers you have. In our Example our tally marks add up to 17.
No comments:
Post a Comment